")
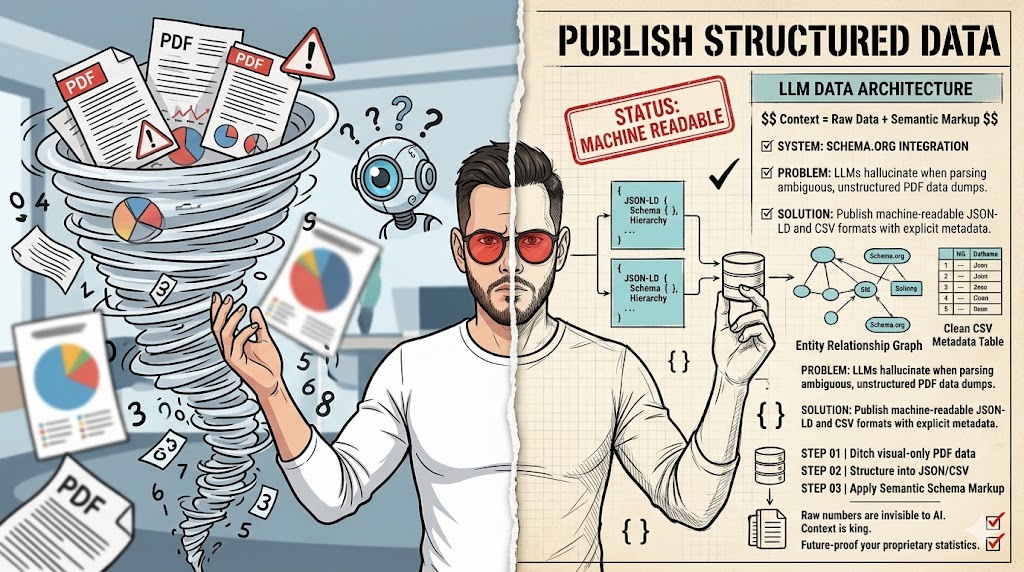
Publish Structured Data. Skip Raw Dumps.
Do publish statistics in structured, machine-readable formats. Don’t just dump raw numbers into PDFs or unstructured text. LLMs thrive on clear context and explicit relationships, which unstructured data lacks.
- Boosts data discoverability and interpretation by AI.
- Requires careful schema design and ongoing maintenance.
- Ideal for proprietary market research, economic indicators, or product performance metrics.
If your statistics are highly sensitive and meant for human eyes only, stop reading; this approach exposes them.
The Hidden Cost of Unstructured Stats: Why LLMs Get Confused
I once saw a company publish a 50-page PDF of market share data. It looked professional, sure. But for any AI trying to make sense of it? Forget about it. LLMs are powerful, but they aren’t mind-readers. They need data served on a silver platter, not hidden in a digital haystack. Your proprietary statistics become invisible to AI when they lack explicit structure.
Think about it. Most businesses still publish their key numbers in reports. These are often PDFs, images, or even just plain text on a webpage. Humans can read these. We can infer meaning from context, headings, and visual cues. An LLM, however, sees a jumble of pixels or words. It struggles to identify what’s a number, what’s a unit, and what that number actually represents. This is a huge missed opportunity for AI SEO automation and broader data intelligence.
The core issue is ambiguity. Is ‘25%’ a growth rate, a market share, or a discount? Without explicit tags, an LLM guesses. Sometimes it guesses right. More often, it hallucinates or completely misses the point. This isn’t just about making your data searchable. It’s about making it understandable by machines. That understanding unlocks new ways to analyze, compare, and leverage your unique insights.
The trap is relying on human interpretation. We assume an LLM can parse a complex chart just like we can. It can’t. It needs the underlying data in a format it can process directly. This means moving beyond presentation and focusing on the raw, structured facts. It’s about feeding the machine exactly what it needs, not what looks good to a human eye.
Pros of LLM-Friendly Data
- AI discoverability: Your data gets found and used by AI tools.
- Better insights: LLMs can analyze relationships and trends more accurately.
- Future-proofing: Prepares your data for advanced AI applications.
Cons of LLM-Friendly Data
- Initial setup time: Requires effort to structure and tag data correctly.
- Ongoing maintenance: Data needs consistent updates and validation.
- Data privacy concerns: Publicly exposing data requires careful consideration.
My Nightmare with a "Smart" PDF Report
I remember a client in 2024. They had this "cutting-edge" report. It was a PDF, full of beautiful charts and tables. They thought it was "LLM-ready" because it had text. I thought, "Okay, this should be easy." Boy, was I wrong. The data was embedded as images or weirdly formatted tables that broke when copied. I spent days trying to extract meaningful numbers for a new AI SEO automation project. It was a mess.
The LLM would hallucinate numbers or completely miss the point. For example, it might pull a percentage from a chart title but ignore the actual data points. Or it would mix up columns because the table structure wasn’t explicitly defined. We lost a week just cleaning that data. The trap is, humans can read it, but machines can’t understand it. This fails when you assume visual presentation equals machine readability. It’s a common mistake, honestly.
The client was frustrated. We were frustrated. The whole project stalled because of this one seemingly small detail. We had to manually re-enter key data points into a spreadsheet. It felt like going back to the stone age. That experience taught me a hard lesson: visual appeal means nothing to an LLM if the underlying structure is broken. You need to prioritize machine readability first, then layer on the human-friendly presentation.
It’s not fun. It’s a grind. But getting this right upfront saves so much pain later. We learned that day that "smart" PDFs are often just pretty pictures to an AI. They don’t offer the explicit structure needed for reliable data extraction. This is why a dedicated complete AI guide for data publishing is so vital.
LLM-Friendly Format: A data presentation method that provides clear, structured information, explicit relationships, and contextual metadata, optimized for interpretation by Large Language Models.
Beyond Basic Tables: Why JSON and CSV Aren’t Always Enough
Most people think "structured data" means JSON or CSV files. And yes, those are a great start. They organize data into rows and columns, or key-value pairs. But just dumping a CSV of sales figures (product, region, count) misses the "why." It lacks deeper meaning. Your data remains ambiguous to LLMs if you only provide raw values without semantic context.
Take a simple CSV: Product,Region,Sales. An LLM can read this. It knows Widget A sold 1200 in North. But what does "Sales" mean? Is it units, revenue, or profit? What timeframe? Is "North" a country, a state, or a sales territory? These details are crucial for accurate interpretation. Without them, the LLM is making educated guesses.
Widget A,North,1200
Widget B,South,800
This is where basic structured formats fall short for proprietary statistics. They provide structure, but not necessarily semantic meaning. For LLMs to truly leverage your data, they need more than just values. They need context about what those values represent in the real world. This is especially true for unique metrics or industry-specific terms. We need to tell the LLM, "This ‘Sales’ figure is actually ‘Gross Revenue in USD for Q3 2026’." That’s the level of detail required for robust AI SEO automation.
So, while JSON and CSV are foundational, they are not the complete solution. They are excellent for data exchange between systems. But for LLMs, which operate on language and understanding, we need to embed that understanding directly into the data itself. This means adding layers of metadata and semantic markup. It’s about enriching the data, not just organizing it. This is a key distinction many miss when they first approach LLM-friendly data.
"@context": "http://schema.org",
"@type": "StatisticalData",
"name": "Q3 2026 Market Share for Widgets",
"description": "Proprietary market share data for Widget A and Widget B in North American region.",
"datePublished": "2026-10-15",
"measurementTechnique": "Internal customer survey and sales data analysis.",
"variableMeasured": [
{
"@type": "QuantitativeValue",
"name": "Widget A Market Share",
"value": 0.25,
"unitText": "percent",
"maxValue": 1.00,
"minValue": 0.00
},
{
"@type": "QuantitativeValue",
"name": "Widget B Market Share",
"value": 0.18,
"unitText": "percent",
"maxValue": 1.00,
"minValue": 0.00
}
]
}
Semantic Markup: The Secret Sauce for AI Understanding
This is where things get really interesting. I once helped a client add Schema.org markup to their product review data. The difference in how Google and other platforms understood their content was night and day. For proprietary statistics, Schema.org is your best friend. LLMs will struggle to connect your statistics to real-world entities if you skip semantic markup.
Schema.org is a collaborative vocabulary for structured data markup. It helps search engines and, critically, LLMs understand the meaning of your content. Instead of just having a number ‘0.25’, you can explicitly state it’s a QuantitativeValue, representing Widget A Market Share, with a unitText of ‘percent’. This removes all ambiguity. It tells the LLM exactly what it’s looking at.
For statistics, specific Schema types like StatisticalData, Dataset, and QuantitativeValue are incredibly powerful. They allow you to define the name of your dataset, its description, the variables measured, and even the measurement technique. This provides a rich context that raw JSON or CSV files simply can’t offer on their own. It’s like giving the LLM a comprehensive glossary and instruction manual for your data.
Implementing Schema.org markup might seem like extra work. But it’s an investment in future-proofing your data. It makes your statistics discoverable not just by traditional search, but by the rapidly evolving world of AI. This is a core component of any complete AI guide for content and data. It ensures your unique insights are not just published, but truly understood and leveraged by intelligent systems. Don’t skip this step; it’s a game-changer for AI interpretation.
WARNING: Data Drift Ahead
Neglecting to version control your published statistics is a critical mistake. LLMs might pull outdated or inconsistent data, leading to incorrect analyses and recommendations, which can severely damage your credibility.
Context is King: Explanations, Definitions, and Units
I’ve seen reports where "growth" was defined differently across sections. One part meant year-over-year, another quarter-over-quarter. For a human, it’s confusing. For an LLM, it’s a recipe for disaster. Your statistics become meaningless to an LLM if you don’t explicitly define terms and units. This is non-negotiable.
Every single metric you publish needs a clear, unambiguous definition. What does "customer churn" mean to your company? Is it lost subscriptions, or just inactive users? What timeframe does it cover? What are the units? Is it a percentage, a raw count, or a rate per thousand? These details must be explicitly stated alongside the data. Think of it as creating a mini-glossary for every dataset.
Beyond definitions, explain your methodology. How was the data collected? What are the limitations? For example, "Data collected via anonymous online survey, N=500, margin of error +/- 4% at 95% confidence." This level of transparency builds trust and helps LLMs understand the reliability and scope of your numbers. It prevents misinterpretation and overgeneralization.
This contextual information can be embedded directly into your structured data using metadata fields. For instance, in JSON-LD, you can add properties like description, measurementTechnique, and unitText. For CSVs, a separate "metadata" header row or an accompanying text file works. The goal is to leave no room for doubt. Clarity is paramount for LLM consumption. Without it, your carefully collected statistics are just numbers floating in the void, waiting to be misunderstood.
Myth
"LLMs are smart enough to figure out my data."
Reality
LLMs are pattern-matching engines; they need explicit structure and context to accurately interpret novel or proprietary data. They don’t "understand" in a human sense.
Internal Data Audit: LLM Readiness (2026)
| Project/Item | Cost/Input | Result/Time | ROI/Verdict |
|---|---|---|---|
| Market Share | JSON-LD | High | Excellent |
| Customer Churn | CSV + Meta | Medium | Good |
| Product Usage | PDF Charts | Low | Poor |
Version Control and Freshness: Avoiding Stale Insights
We once published a quarterly report, but the internal team kept updating the numbers without changing the public-facing version. This caused a lot of confusion. An LLM doesn’t know if data is old or new unless you tell it. Your data loses credibility when LLMs access outdated versions, leading to incorrect conclusions.
Every piece of published data needs clear versioning. Think of it like software releases: v1.0, v2.1, etc. This helps track changes. Along with a version number, include a dateModified or datePublished timestamp. This signals to the LLM exactly when the data was last updated. It’s a simple tag but incredibly powerful for maintaining data integrity.
Why does this matter? Imagine an LLM pulling your market share data from 2024. If your competitor’s data is from 2026, any comparison will be skewed. The LLM might generate insights based on stale information, which could lead to bad business decisions. This is particularly critical for fast-moving industries where numbers change constantly.
You also need a strategy for how often you’ll update your data. Is it daily, weekly, quarterly? Make this clear in your documentation or metadata. For critical metrics, consider real-time updates where feasible. For less volatile data, a quarterly refresh might be enough. The key is consistency and transparency. Always indicate data freshness. It’s a small detail that makes a huge difference in how your data is perceived and used by AI systems.
– Is a ‘dateModified’ or ‘datePublished’ timestamp included?
– Is the update frequency (e.g., daily, quarterly) documented?
– Are old versions archived or clearly marked as superseded?
– Is the data source and collection date specified?
Testing Your LLM-Friendly Data: The Final Check
I’ve spent hours debugging why an LLM couldn’t find a specific data point, even after I thought I’d structured it perfectly. It’s frustrating. Your efforts are wasted if you don’t test how LLMs actually interpret your structured data. This isn’t a "set it and forget it" situation.
After you’ve structured, marked up, and published your data, the real work begins: testing. Use a public LLM (like ChatGPT, Claude, or Gemini) to query your data. Ask specific questions that your data should be able to answer. For example, "What was the Widget A market share in Q3 2026?" or "Describe the methodology for collecting customer churn data."
Pay close attention to the answers. Does the LLM provide the correct numbers? Does it understand the context? Does it hallucinate or make up information? If it struggles, that’s your cue to go back and refine your structure, definitions, or metadata. It’s an iterative process. You might find that a certain phrasing in your description confuses the model, or a unit isn’t being interpreted correctly.
This testing phase is critical. It’s your chance to catch errors before your data is widely consumed. It helps you understand the nuances of LLM interpretation. Remember, even with perfect structure, subtle ambiguities can still trip up an AI. Regular testing ensures accuracy and validates your LLM-friendly approach. It’s the ultimate quality control for your data pipeline. Don’t skip this step; it’s where the rubber meets the road.
"The future of data isn’t just about big numbers; it’s about making those numbers speak to machines."
— General Consensus, AI Data Strategists
Insider tip
I always start with the end in mind: how will an LLM use this data? That guides my structuring process from the beginning. It helps me prioritize what context and metadata are truly essential.
What I would do in 7 days
- Day 1-2: Identify Key Statistics. Pick 1-2 most important proprietary statistics you want LLMs to understand.
- Day 3: Design a Simple Schema. Create a basic JSON-LD schema (using Schema.org types) for those chosen statistics.
- Day 4-5: Implement and Enrich. Populate the schema with your actual data, adding all necessary definitions, units, and methodology.
- Day 6: Publish on a Dedicated URL. Host the structured data on a publicly accessible, stable URL.
- Day 7: Test with an LLM. Query a public LLM with questions about your published data to check for accuracy.
LLM-Friendly Data Checklist
- Is data in structured format (JSON, CSV, XML)?
- Is Schema.org markup applied where appropriate?
- Are all terms and units explicitly defined?
- Is versioning and freshness clearly indicated?
- Have you tested LLM interpretation with queries?
Frequently Asked Questions
What if my data is highly sensitive?
For highly sensitive data, public exposure is not advisable. Consider using private, enterprise-grade LLMs with strict access controls, or simply keep such data for internal human analysis only. The LLM-friendly approach is primarily for data you intend to share or make discoverable.
How often should I update my LLM-friendly data?
Update frequency depends on the data’s volatility. For rapidly changing metrics, aim for daily or even real-time updates. For stable, historical data, quarterly or annual updates might suffice. Always ensure your dateModified timestamp is accurate.
Can I still use images for charts and graphs?
Yes, absolutely. Images are great for human visualization. However, always provide the underlying raw, structured data (e.g., in JSON or CSV) alongside the image. This allows LLMs to access the precise numbers, while humans enjoy the visual representation.